Financials
The finance reports — a scorecard, utilisation, project profitability, WIP and ageing, the tax return, and the exceptions list that says what to do on Monday.

What it is
Financials is what the work earned. Six tabs — Scorecard, Utilization, Profitability, WIP and billing, Tax return and Exceptions — each fetching only its own payload, and each carrying the assumptions behind its numbers on the page rather than in a tooltip.
It is deliberately separate from Reports, which answers "how is delivery going". This one answers "what did it earn", and the two are gated by different permissions.
How to get there
Insight → Financials in the admin console rail. The ADMIN role is needed to open the console.
The reports are layered on three keys, and the difference between them matters:
report.utilization— hours and percentages for other people. Without it you still see your own row; the screen says so.report.financial— revenue, billing and margin. The delivery-manager tier.report.cost— cost rates, labour cost, vendor cost and committed spend. Salary-adjacent, and deliberately not implied byreport.financial.finance.tax.view— the Tax return tab, which has its own endpoint and does not depend on the reporting keys at all.
Two different refusals, and they are not interchangeable:
- Profitability, WIP and the margin waterfall are a hard 403 without
report.financial. There is no self-scoped version of them that means anything, and an empty table would read as "the company made nothing" rather than "you may not see this". You get a notice saying which permission is missing. - Everywhere else the money keys are deleted from the response, not zeroed and not dashed. The column simply is not drawn. A zero would be averaged into something downstream; a dash would imply the number is unknown rather than restricted.
No plan gate.
How to use it
Read the scorecard
- The landing tab is up to nine KPIs, each with the same metric for the previous period beside it, its band said in words as well as colour, and its target where there is one.
- Percentage metrics move in points, not percent, and the delta says so.
- Most tiles are clickable and drill into the tab behind them; contracted backlog links out to revenue recognition, which is its own report.
- There is deliberately no composite health score — one index moves for reasons nobody can name and hides the metric that actually went wrong.
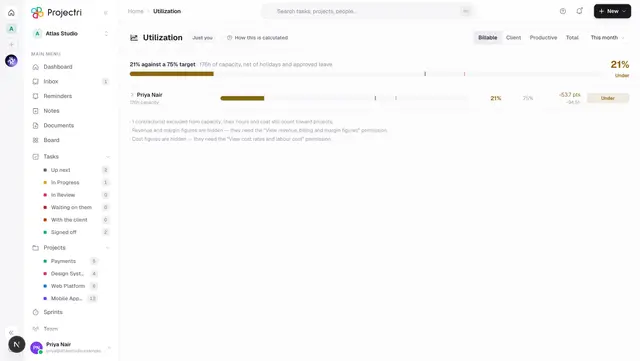
Cut utilisation
- Choose the reporting period in the page header: this month, last month, this quarter, this year, or year to date.
- Group by person, role, team, department, cost centre, project or client. The last two are entity groupings and drop the capacity, target and variance columns, because a project has no capacity.
- Billing model filters to time-and-materials, fixed, retainer, AMC or milestone-based. Fixed-fee and T&M respond to extra hours in opposite directions, which is why the cut is a first-class filter.
- Rows show hours against capacity, with holiday and leave hours named underneath so the denominator can be checked.
- Burnout risk below the table counts consecutive weeks over target, week by week — not an average, which hides exactly the pattern being looked for.
Find the projects losing money
- Open Profitability. Rows are sorted worst-first by risk, not alphabetically.
- The tiles across the top are revenue, direct cost, committed, gross margin, margin percent and effective rate — with cost and committed present only if you may see them.
- A project with unrated hours says so under its name: the margin beside it is overstated by whatever those hours cost.
- VAC is variance at completion; negative is drawn in red.
- Press Waterfall on a row to decompose that project's margin into what ate it — scope creep, non-billable time, expenses, write-offs. A single "51%" tells a delivery lead nothing to act on; this says which of four conversations to have.
Read WIP
- WIP and billing leads with the ageing buckets rather than the balance, because unbilled work does not hold its value.
- Risk-adjusted is that balance discounted by age. Days outstanding, Awaiting approval and Unbilled expenses sit beside it.
- The client table is oldest-unbilled first, with each row's bucket colour matching the chart above it.
File a tax return
- Tax return ignores the page's relative period and carries its own dates, with quarter presets — a return is filed for a quarter with a legal start and end, and "last 90 days" is never that quarter.
- The figures come off the breakdown each invoice froze at issue, never a recomputation. The number you file is the number that was printed.
Work the exceptions list
- Exceptions is ranked worst-first: high, medium, low, with the count of high ones badged on the tab.
- Data-quality problems are ranked beside commercial ones on purpose — a margin with a silent hole in it is the more dangerous of the two.
- Every row names its own destination and is a link. Clicking one goes to the project, the screen or the console page where the fix is made.
What it affects
- Nothing. Every tab here is a read. What it changes is what people do next, which is why the assumptions block at the bottom of each tab is not optional reading.
- **It exposes gaps in Finance setup.** Missing cost rates, missing working calendars, missing exchange rates and unassigned cost centres all surface here as caveats and exceptions rather than as errors.
- The exceptions list is the entry point to fixes elsewhere — an over-budget project, an unapproved timesheet, a rate that was never set.
On mobile
The Financials screen in the phone app re-cuts five of the same payloads around the question people ask away from a desk — "is anything wrong, and with what". Scorecard is one KPI per row; profitability is worst-project-first with only the columns your permissions leave; WIP is the balance then the ageing tail; exceptions is the same list in the same order; and opening a project from profitability gives the margin waterfall. Every boundary, sort order and column rule comes from the same shared module the web uses, so a pane and a table cannot disagree about which project is worst.
Limits and gotchas
- A margin figure can be quietly incomplete. Hours with no rate are excluded from cost, so the margin is overstated; the row says how many hours, and the assumptions block says it again for the whole report.
- **
report.financialdoes not grant cost.** A reader with revenue but not cost sees revenue, margin and effective rate and no labour, expense, vendor or committed columns. That is intentional: cost rates are one join away from salaries. - Vendor and committed columns only appear when they are non-zero. They are meaningful only for a workspace that subcontracts or raises purchase orders, and a permanently-zero column invites "what am I failing to record?".
- Committed is not cost. It is drawn lighter beside the three that are, because it is the reason a healthy-looking margin may not survive delivery.
- The tax tab is gated separately, so it renders even when the rest of the page has hit a permission error, and vice versa.
- Every figure on the page totals in the workspace reporting currency, which is named in the page subtitle.
Related
- Reports — delivery, budget and executive health, on a rolling window.
- Finance setup — the rate cards, calendars and rates these numbers divide by.
- Invoicing — turning WIP into invoices.
- Receivables — what happens after the invoice goes out.
- Utilisation — the same measure from a member's own view.