Demand forecast
Which roles the firm will be short of, in which months, and by how many people, from committed bookings and the open pipeline together.
What it is
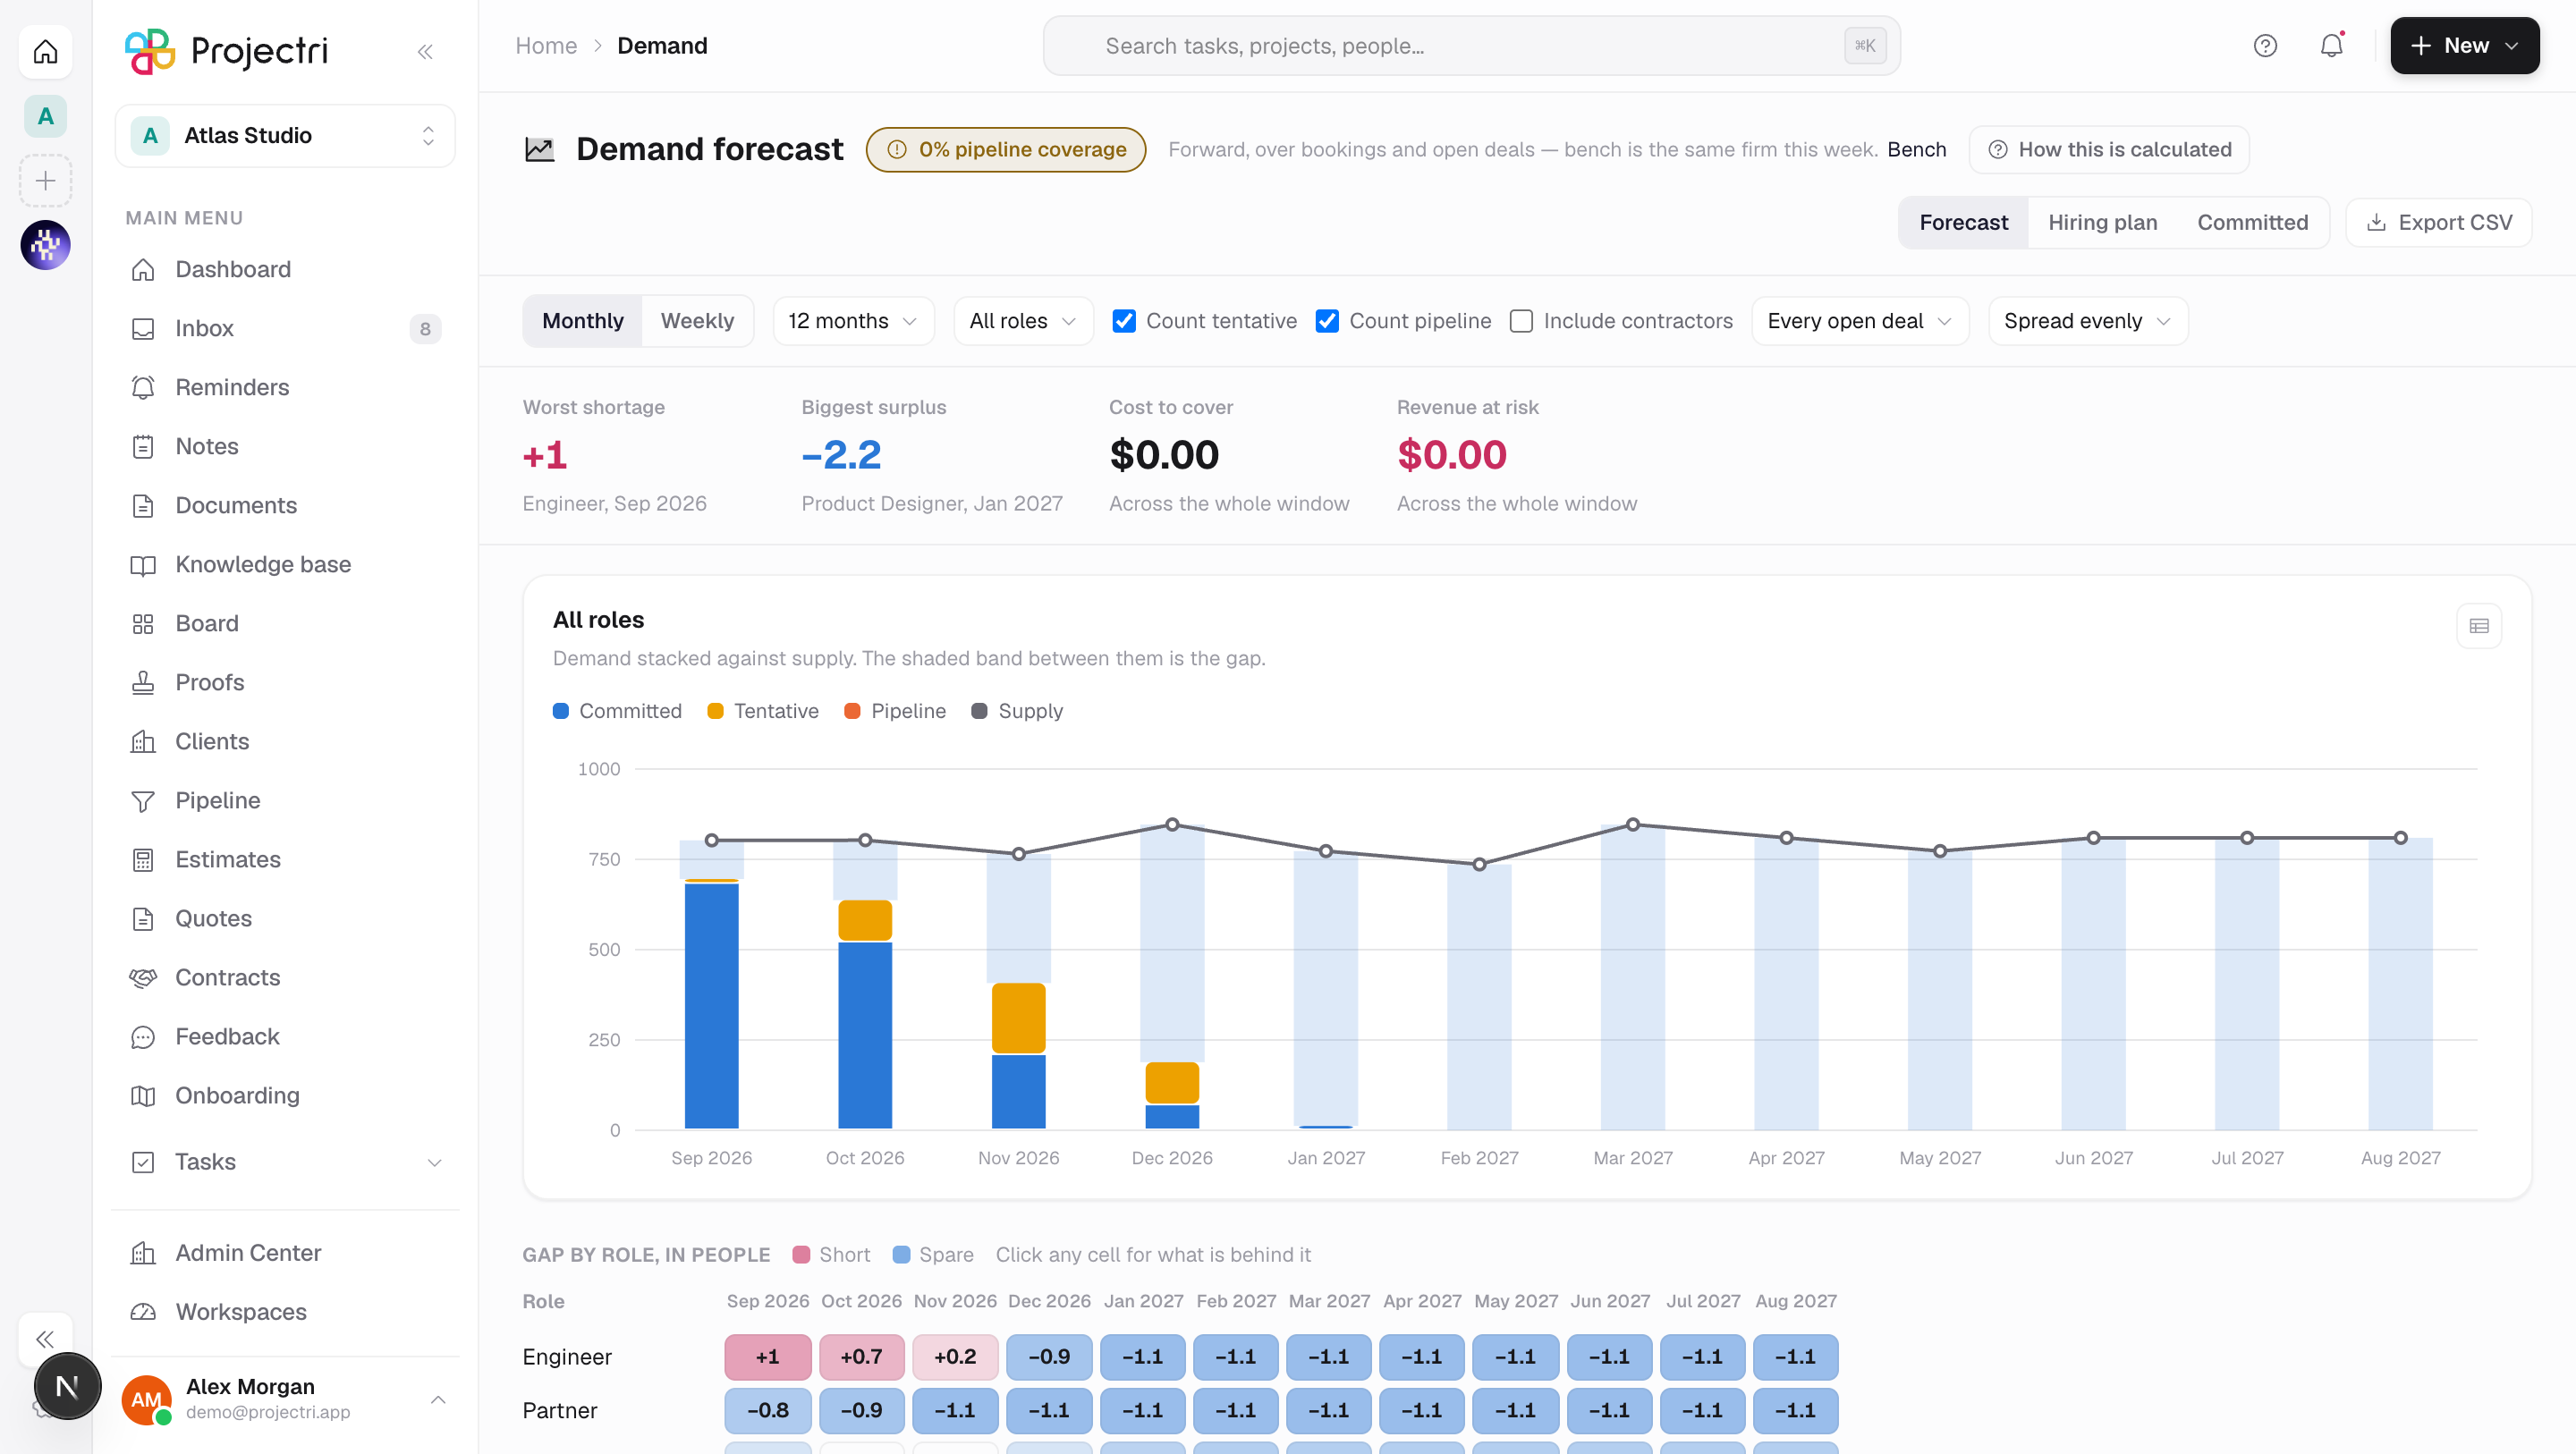
The demand forecast puts supply and demand on the same axis for the year ahead. Demand is bookings already made plus the estimated work on open deals, weighted by how likely each deal is; supply is capacity. The gap between them is expressed in people, so the answer is a sentence somebody can repeat — we will be 2.4 senior developers short in October.
How to get there
Demand is in the main navigation, gated on booking.view. That key rather than a reporting key, because this screen is the staffing plan and the sales pipeline in one table and both are commercial intelligence.
The forecast needs the **resourcing.forecast** entitlement. Without it the routes answer with a plan gate rather than data.
Three further keys change what is on the page:
opportunity.viewadds the pipeline half. Without it the report still answers the committed question rather than refusing — a delivery lead who cannot see deals can still see the staffing gap.report.costadds Cost to cover.report.financialadds Revenue at risk.
Money columns are absent without their key, never zeroed.
How to use it
Read the sentence
- The strip under the controls is the worst shortage and the biggest surplus, each in people, each naming the role and the period.
- Beside them, where permitted, are the cost to cover the gaps and the revenue at risk across the whole window.
Check the coverage first
- The badge next to the title is pipeline coverage — how many open deals have a primary estimate attached.
- It turns amber below 60%. Roles for the deals without an estimate are **not forecast at all**; they are missing from these numbers rather than counted as zero, which is the difference between a cautious forecast and a wrong one.
Tune the assumptions
- Monthly / Weekly sets the granularity. A weekly view shortens the window automatically, because eighteen months of weeks is 78 unreadable columns.
- Horizon offers 6, 12 or 18 months.
- Count tentative decides whether provisional bookings count as demand.
- Count pipeline turns the speculative half on and off. With it off, the probability floor and the spread control disappear rather than sitting there meaning nothing.
- Minimum probability floors the deals included — every open deal, or 25%, 50%, 75% and likelier. There is deliberately no hidden floor.
- Spread decides how a deal's estimated effort is laid across its months — evenly, front-loaded or back-loaded.
- Include contractors adds contract capacity to supply.
Drill into a number
- Click any cell in the grid, or any band on the chart.
- The panel lists the bookings, placeholders and open deals behind that cell, and prints their sum against the cell above.
- If those rows do not add up to the cell, the panel says so and tells you to treat the forecast as unreliable. A forecast nobody can check is a picture.
Read the hiring plan
- Switch to Hiring plan.
- It lists gaps that persist — a role short for several periods running, with the start, the number of periods and the average shortfall in people.
- The sustained for control sets how many consecutive periods count. Shorter gaps are overtime, a contractor, or a date that can move.
Read what is already sold
- Switch to Committed.
- This is placeholder bookings on won projects with nobody in them — unfilled work the firm has already been paid to do.
- It is unweighted, unlike the forecast. A role 60% likely to be needed twice is not a person you can employ 1.2 times.
- Include deals we have not won widens it to speculative work.
Export
Export CSV writes every role against every period with supply, committed, tentative, pipeline, demand, gap hours and gap in people, plus whichever money columns you may see.
What it affects
- Nothing is written here. The forecast is derived from bookings, project placeholders and opportunity estimates. It moves when those do.
- Grid colours. Red is short, the first chart colour is spare. A cell is drawn from the gap in people, not in hours, so a role with a 40-hour weekly team and a role with a 400-hour one are comparable by eye.
- Where a gap comes from. A sustained shortage usually means either unstaffed placeholders on won work, or a deal whose estimate has just landed. The drill panel names which.
On mobile
The Expo app has Demand. The phone carries the sentence, the coverage line under it, one role's gap per period as a bar diverging from a centre rule, and the hiring plan. Grouping, the CSV and the full role-by-period grid stay on the web, where there is width for them.
Limits and gotchas
- The committed view reads at most a year at a time and says so when it shortens your window. Use the forecast for longer horizons.
- Supply is capacity net of holidays and approved leave, divided across the workspace's working days — which come from the country the workspace was created with. A wrong working week moves every supply figure on this page.
- How this is calculated prints the engine's own formula and assumptions verbatim, for the same reason Bench does.
- The window starts at the beginning of the current month, in UTC, and is read once when the page loads.
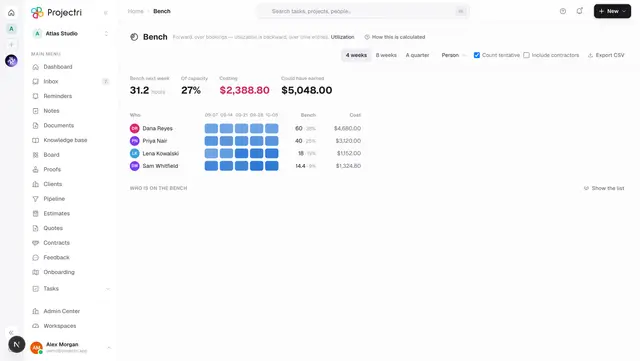
- Demand is forward over bookings and open deals. Bench is the same firm this week, over bookings only.
Related
- Bench — the near-term half of the same question.
- Resourcing — where the bookings and placeholders come from.
- Pipeline — the deals and estimates the speculative half reads.
- Plans and entitlements — what
resourcing.forecastis on.