Report builder
Build a report the fixed pages do not have — pick the data, group it, measure it, cross-tab it, save it, export it and put it on a schedule.
What it is
The report builder answers a question nobody built a page for. You pick a dataset, drag fields into groupings and measures, set a window, and the table under the controls answers as you type. A report you like can be saved, shared, starred, exported as CSV and delivered on a schedule. It is the same screen for reading somebody else's saved report as for composing your own.
How to get there
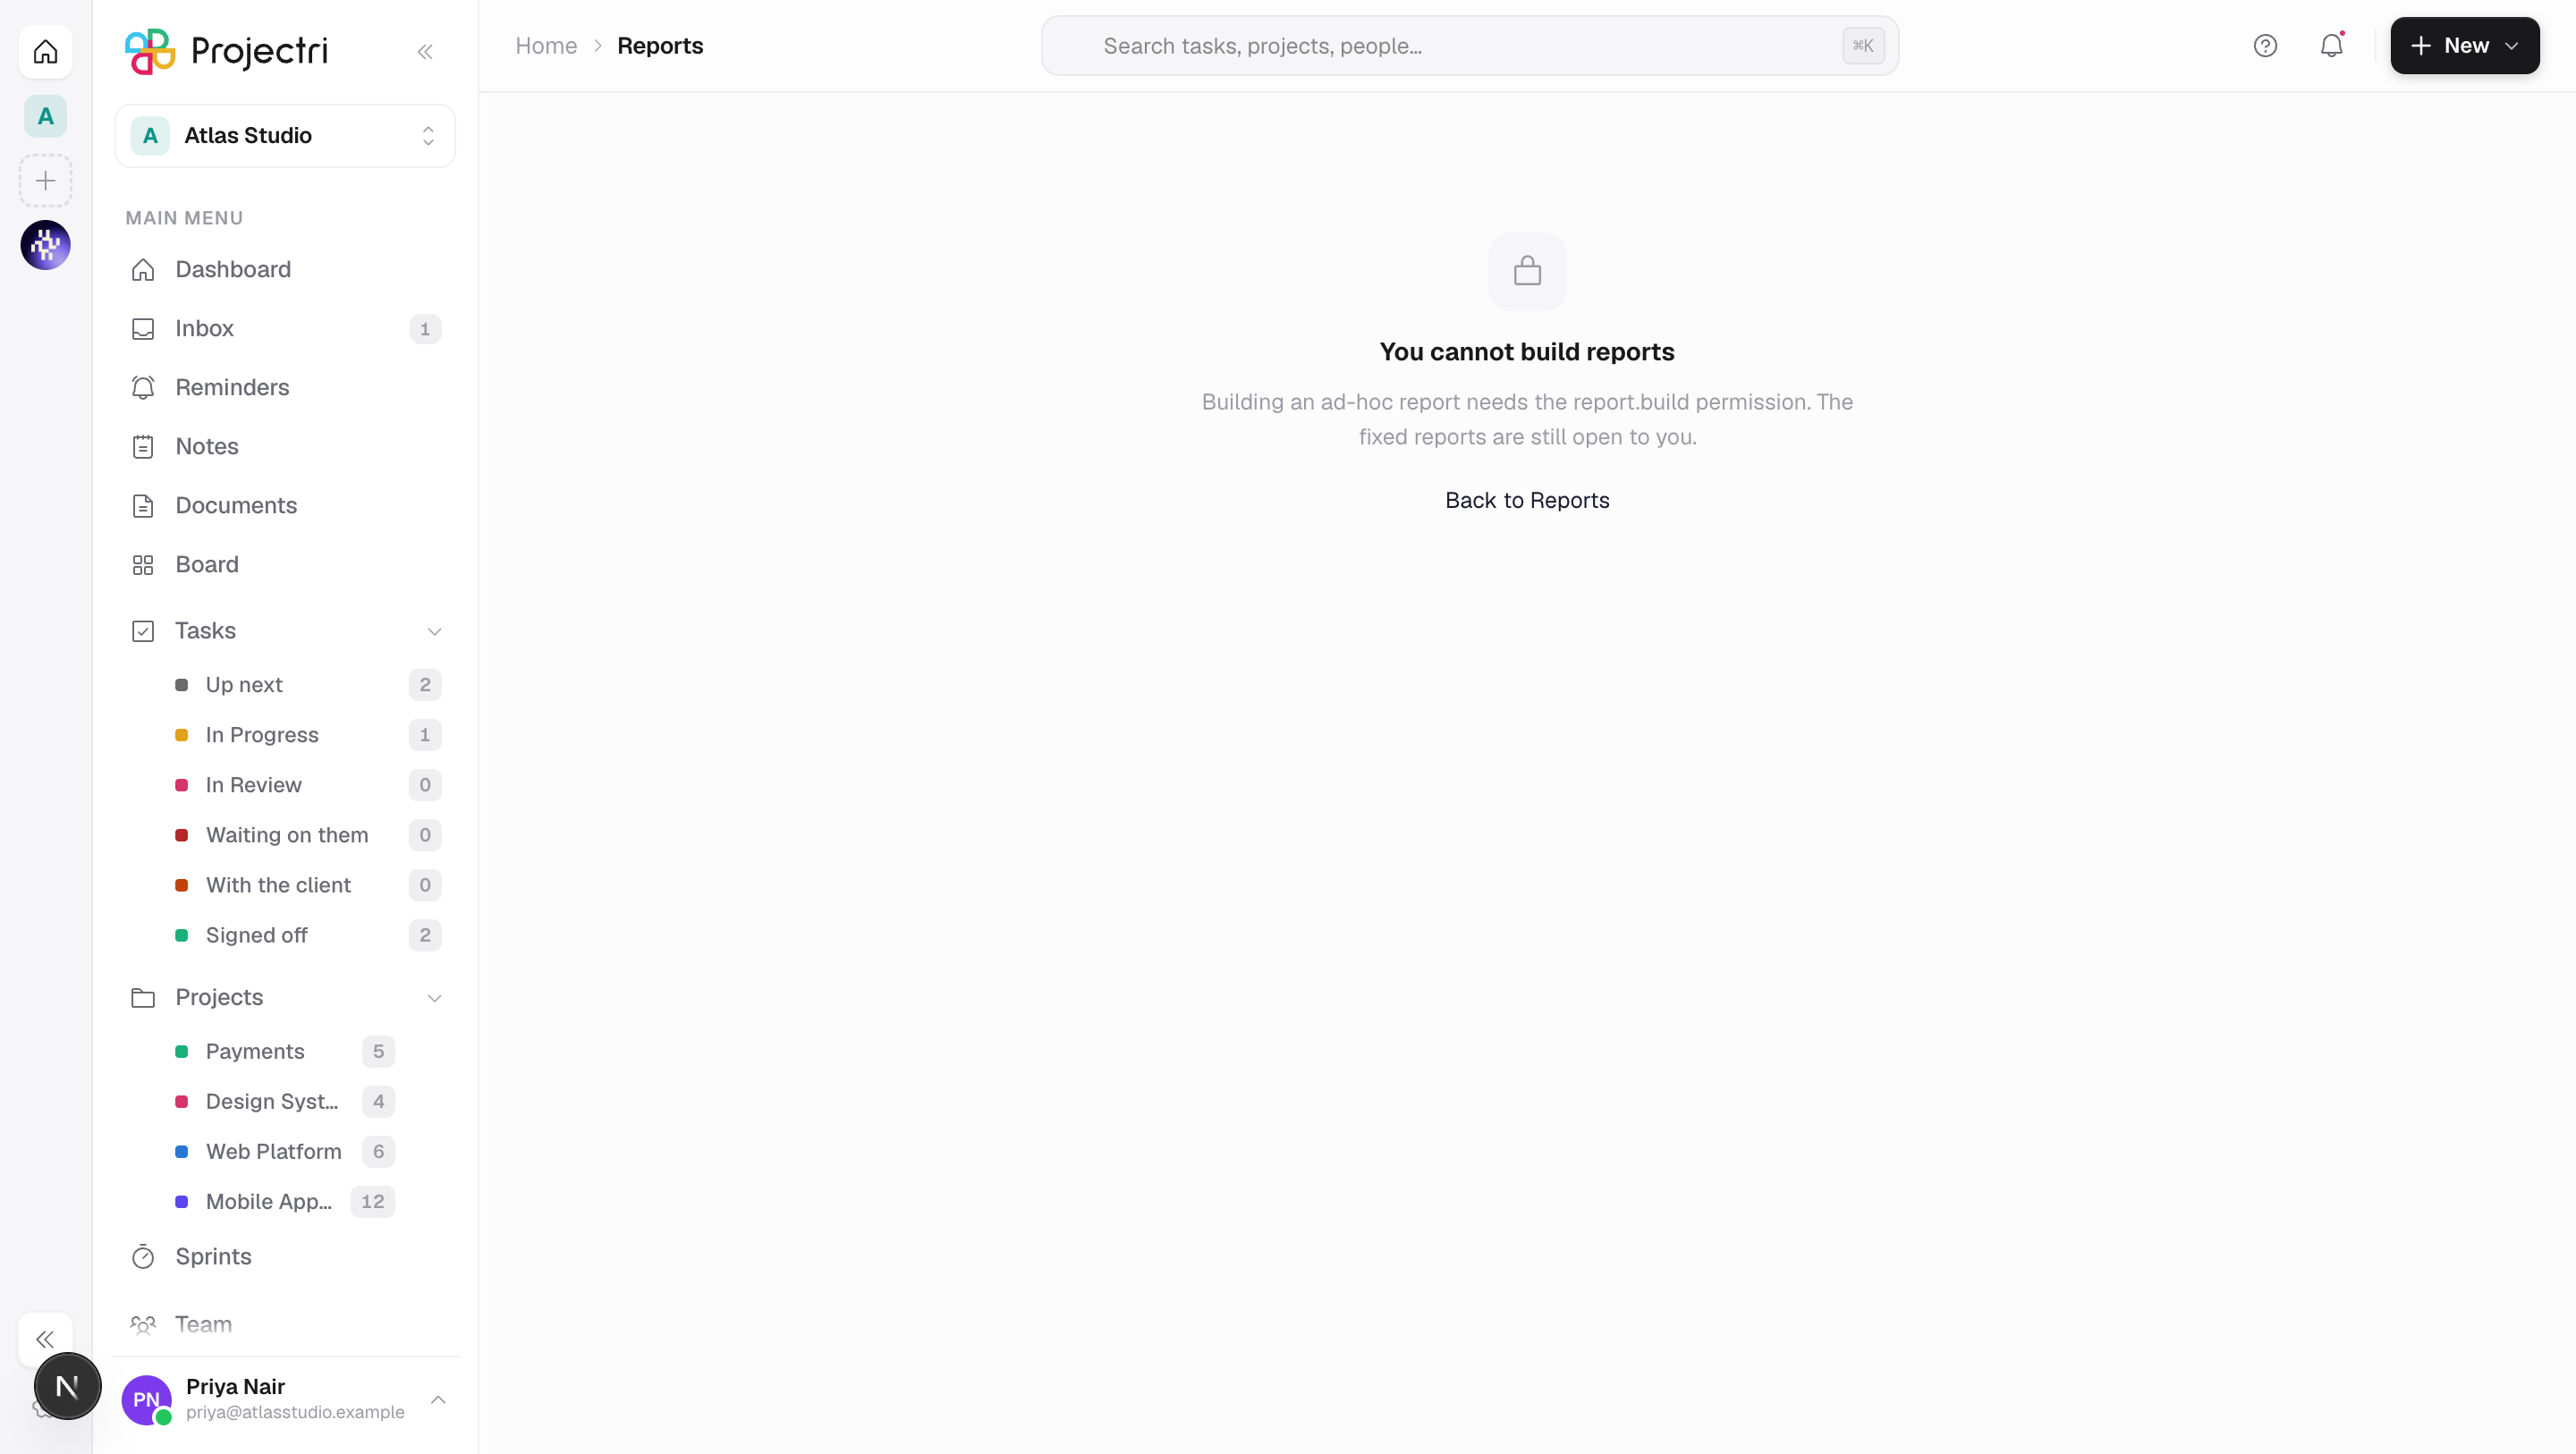
Report builder sits under Reports in the main navigation. The row and the screen need the report.build permission — reading a colleague's shared report and composing one are different acts, so report.view alone gets you the saved list but not the composer. The builder is also plan-gated on the reporting.builder entitlement, which is a Pro-tier feature.
Two narrower keys govern what you can do once you are here. report.publish is needed to share a report with the whole company, and to edit or delete a report somebody else owns. report.export is needed for the CSV download of a saved report.
If the whole screen opens on "You cannot build reports", that is the missing report.build. If it opens on "Nothing to report on yet", you have the key but every dataset is behind a permission you do not hold.
How to use it
Pick the data
- The Data picker at the top of the field rail lists the datasets you may read. Today those are Tasks, Worklog, Worklog revenue and cost, Support tickets, Work orders, Client invoices, Project expenses, Projects and Customer contacts.
- A dataset behind a permission you lack is not shown greyed out — it is absent. Worklog revenue and cost needs
report.financial; Client invoices needsfinance.invoice.view; Project expenses needsfinance.expense.view; Customer contacts needsportal.view. - Individual fields are gated too. The Cost measure on Worklog revenue and cost needs
report.coston top of the dataset's own key. - Changing the dataset resets the definition. It cannot be carried across:
projectIdexists on both andbillabledoes not, so half the fields would silently mean something else.
Compose the question
- Search the field rail and click a field to add it. Fields land in **Group by or in Measure**, depending on which list you added them from.
- Group by takes up to 4 fields. A date field added as a grouping gets a Bucket — Daily, Weekly, Monthly, Quarterly or Yearly. Only one date grouping is allowed per report.
- Measure takes up to 12. The aggregations are Sum, Average, Minimum, Maximum, Count and Calculated. Everything except Count and Calculated needs a field.
- Calculated is a formula over the other measures in the same report — for example
revenue - cost. It may reference any non-formula measure and nothing else; a formula referencing another formula is refused rather than ordered. - Filters narrow the rows. The conditions available depend on the field type — is, is not, is one of, is none of, more than, at least, less than, at most, contains, is empty, is set, in the last (days), in the next (days).
- Window is a From and a To date, and it is required. It applies to the dataset's own date field, named beside the control. A window wider than 1,100 days is refused.
- Clicking a column heading in the table sorts by it, and clicking again reverses. You can only sort by a column the report actually has.
Watch the preview
The table below the controls re-runs itself about a third of a second after you stop typing, capped at 200 rows server-side, and the strip above it reports the row count, how long the run took, the currency of any money column and the words "Preview — first 200 rows".
Press Run for the full execution, up to 5,000 rows. A truncated result says so above the table rather than in a footnote.
If the definition cannot run, the reason appears in a red strip and names the control to fix — a missing measure, a missing window, an end date before the start, too many groupings, an empty formula. A pivot that cannot be drawn yet gets its own quieter note, because a missing control is not an error.
Cross-tab it
- Switch the view toggle in the header from Table to Pivot view.
- Choose a field for Across the top, and keep at least one grouping down the side and one measure.
- Show subtotals adds row subtotals and a grand total. They are computed by their own separate grouping rather than summed across the cells, which is why an Average column stays an average and not a mean of means.
- A blank cell means no measurement was taken in that bucket, not zero.
- The column axis is capped at 50 columns; beyond that the report says how many further columns exist and suggests a narrower range or a coarser bucket.
- The pivot refuses four shapes and names each one: no measure, no row grouping, no column axis, the same field on both axes, and dates on both axes.
Chart is the third view. It refuses shapes it cannot draw honestly — it needs at least one measure and exactly one grouping, because with two the bars are one per combination and the axis reads like a trend that is not there.
Save it
- Press Save. An unsaved report is fully usable first — run it, chart it, export it — so naming it is the second step.
- Give it a name and, optionally, a description answering *what question does this answer?*
- Choose who can open it: Only me, My team (then pick the team) or Everyone. Sharing with everyone needs
report.publish. - Sharing shares the question, not the numbers. Whoever opens a shared report runs it under their own permissions, and a column they may not read is left out for them and named.
- Saving again under the same name updates the report; changing the name saves a new one. An open report with unsaved edits says Unsaved changes beside its title.
Work the saved list
- The left rail lists saved reports under three lenses — All, Starred and Mine.
- The star is yours alone, so two people starring the same report do not overwrite each other.
- Each row shows the dataset, who owns it, whether it is shared, and what its last run cost in rows and milliseconds — worth knowing before you open a nine-second report.
- Delete asks first. Deleting keeps the run history: the question "what was running slowly last quarter" must not lose its answer because somebody tidied up.
- Opening a saved report loads its definition into the same controls. A report saved as a cross-tab reopens as one.
Export it
- Press Export for a CSV.
- A saved report with no unsaved edits goes through the server, which re-runs it under your permissions, applies the same caps, and writes the context into the file itself — a Total row, a *"Truncated — showing the first N rows" line, and a "Columns omitted (not permitted)"* line where they apply. A spreadsheet forwarded onward has lost every bit of context except its rows, so the context goes in the rows.
- An unsaved or edited report is written from the result on screen instead, so the file and the screen agree.
- A cross-tab exports as a cross-tab, subtotals included, rather than as flat rows for a spreadsheet to re-pivot.
Schedule it
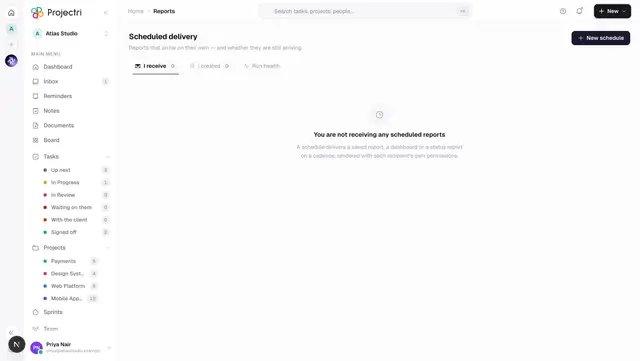
A saved report is one of the things scheduled delivery can send. Create the schedule there, pick Saved report as what to send, and choose it by name.
What it affects
- Saved reports become schedulable. Anything you save appears in the "which one" picker on scheduled delivery, filtered by the same visibility rules — an id offered there is an id the schedule will accept.
- Every execution is recorded. Previews included, because previews are the majority of runs and the ones most likely to be pathological. Those rows are what the Run health tab on scheduled delivery reads.
- Sharing changes who can find it, never what they see. A margin report shared company-wide opens for everyone and opens without the margin column for a reader who lacks
report.financial, with the omission named. - Money columns arrive in the workspace reporting currency. Every money field on every dataset is a converted base column, frozen at the rate in force when the row was written, so one currency code covers a whole result.
- Deleting a report leaves its run history behind. The history row keeps the timing and drops the link.
On mobile
The phone reads; the web builds. Saved reports in the app lists what exists, with the subtitle derived from the definition — "Sum of bill amount base by client by month" — because half of all saved reports are called something like "Q3". Tapping one runs it.
The one edit a thumb gets is the window: As saved, Last 30 days, Last 90 days or This year. Fields, filters and grouping stay on the web, where the field rail is. The dimension column is pinned and the measures scroll sideways; with more than one measure the phone shows one at a time, chosen by a chip. Truncation is a banner above the table, never a footnote, and any column you may not read is named in a notice rather than quietly missing.
Limits and gotchas
- The window is required and finite. No "all time". An unbounded report builder over a fact table is an outage generator, and the maximum span is 1,100 days.
- Rows are capped at 5,000, previews at 200. Past that the answer is a warehouse export, not a report.
- Time is bucketed in UTC, and weeks are Monday-anchored regardless of the workspace's working-week setting, so two screenshots of the same week cannot disagree because somebody changed a locale in between.
- A dataset is fixed at save. You can edit a saved report's name, description, definition and visibility, but not the dataset it reads. That is a new report.
- A measure you may not read is refused by name, never returned as null. A blank cost column reads as "this was free", which is worse than an error. A calculated measure whose inputs were denied is dropped and named too.
- Three reports run at once per workspace, with a 20-second limit on a full run and 5 seconds on a preview. A busy Monday morning becomes a queue rather than an outage.
- A definition is re-validated on every run, not only on save. A report built on a field that has since been retired fails loudly rather than quietly dropping the column — a report missing a filter returns more rows, not fewer.
- PDF and spreadsheet are not offered here. The builder writes CSV.
Related
- Reports — the fixed pages, and the link that brings you here.
- Scheduled delivery — putting a saved report on a cadence.
- Exports — what the other download formats do.
- Permissions — why a column can be absent rather than blank.