Capacity
Committed hours against contracted hours week by week, built from the estimates on dated tasks, so an overloaded week is visible before it arrives.
What it is
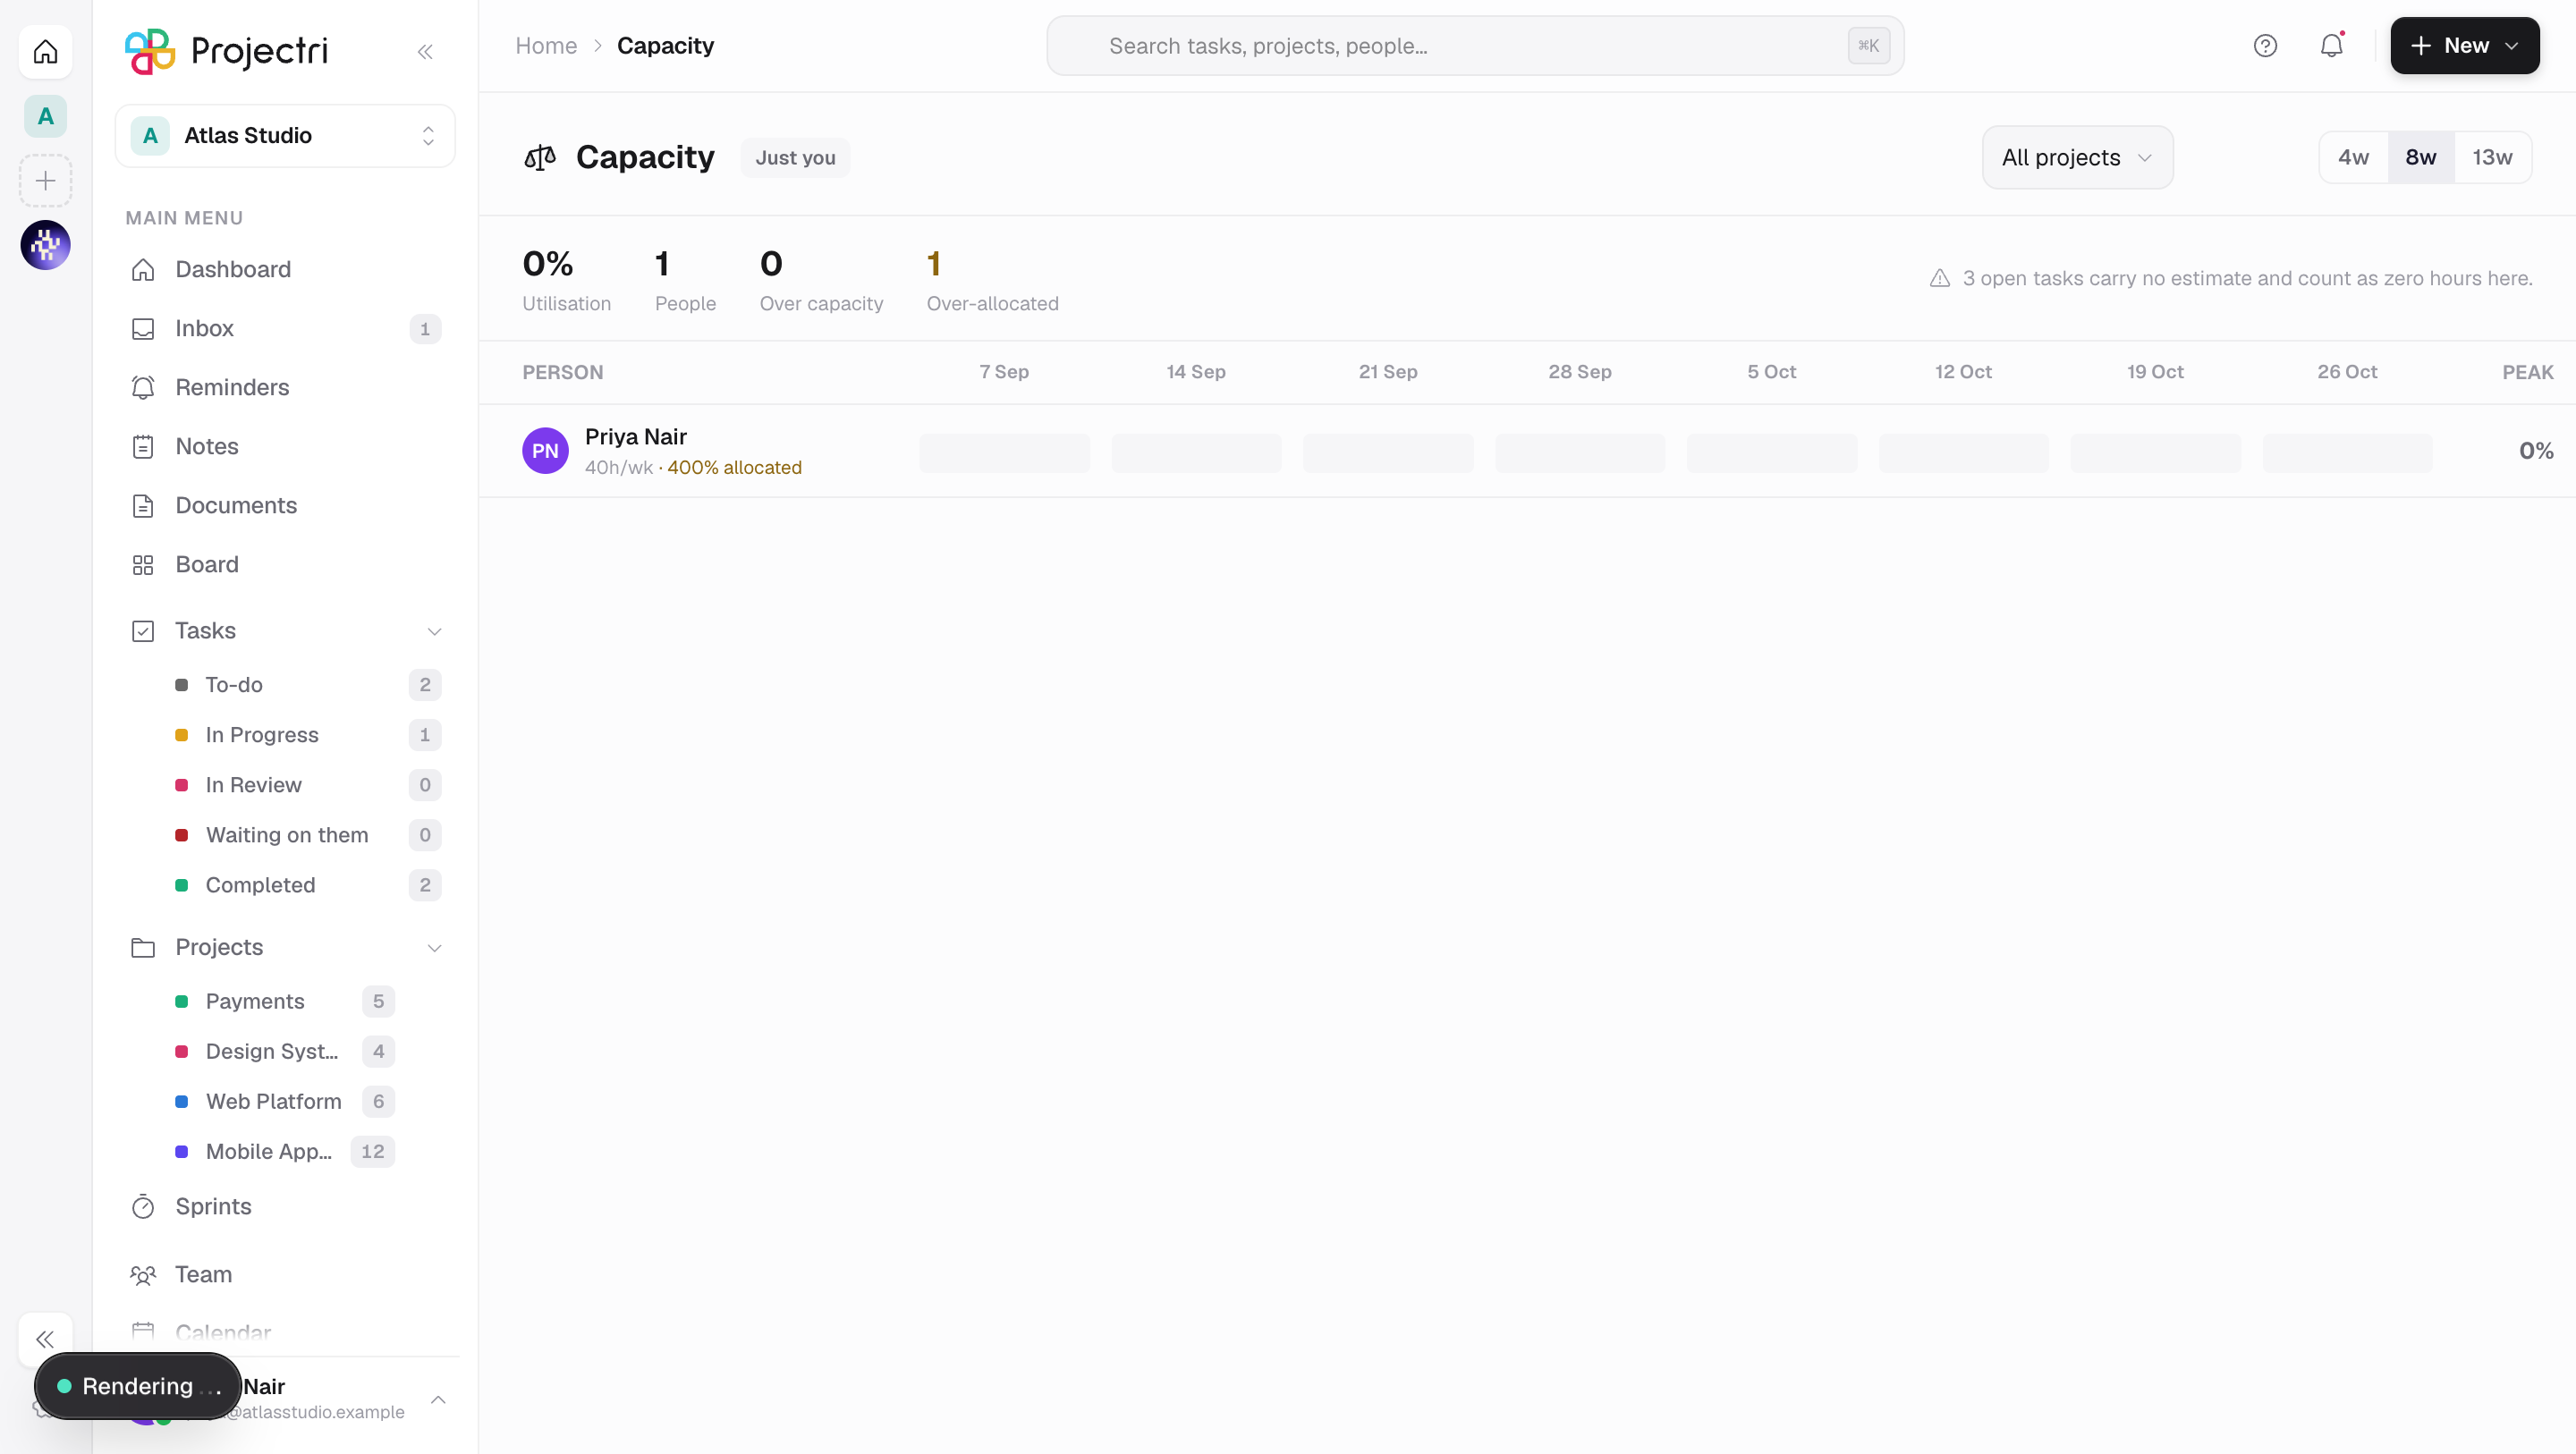
Capacity is a grid of people against weeks. Each cell is the estimated hours already assigned to that person in that week, as a percentage of their contracted hours. It is built from open tasks that carry an estimate and dates, which makes it the delivery-side answer to "is next week possible".
How to get there
Capacity is in the main navigation, gated on report.utilization.
The route itself is not gated. Everyone sees their own row without any permission; report.utilization is what widens it to the whole team. The badge beside the title says Just you or Whole team, because a member seeing one row otherwise cannot tell "I am the only one" from "I am not allowed to see the rest".
There is no plan gate on this screen.
How to use it
Read the grid
- Rows are sorted by each person's worst week, so whoever is most overloaded is at the top.
- A cell's bar is capped at the full height of its track and the percentage above it carries the overflow — a bar that grew past its row would make the worst case the hardest one to read.
- Under 80% is slack, 80–100% is full, and over 100% is a promise that cannot be kept.
- The Peak column on the right is the worst week in the window, with the number of weeks over capacity underneath it.
Change the window and filter
- The 4w / 8w / 13w buttons change how far forward the grid runs. It always starts from the current week.
- The project menu narrows the grid to one project's work.
See where somebody's load comes from
- Click a row.
- It expands to show which projects claim them and at what percentage, their contracted hours a week, their allocation on paper, and their recorded skills.
- A person allocated to no project gets a plain sentence saying so — the hours above come from tasks assigned to them directly.
What it affects
- Nothing. Capacity is read-only. It changes when the work does — an estimate typed on a task, a due date moved, an assignee changed.
- Two different failures, reported separately. Over capacity means the dated, estimated work exceeds the contracted hours. Over-allocated means the project memberships already claim more than 100% of the person before any task is dated. They go wrong for different reasons and are counted in separate tiles.
- Unestimated work is counted and named. Open tasks with no estimate are invisible to this arithmetic, so the number of them is printed in the summary strip and again on each expanded row. A capacity figure that quietly ignores half the queue is worse than no figure.
On mobile
The Expo app has Capacity, with the same scope rule and the same header badge. "Am I overloaded next week" is a question people ask away from a desk, so the phone carries the weekly figures and the unestimated count.
Limits and gotchas
- Effort is spread evenly across the weeks a task spans. Nothing in the data says when within a task the work lands, and a guess that looks precise is worse than a flat one that obviously is not.
- Only work that is dated, estimated, assigned and not closed contributes. A task that overlaps the window at either end counts towards the weeks it overlaps.
- Contracted hours default to 40 a week where a membership has none set.
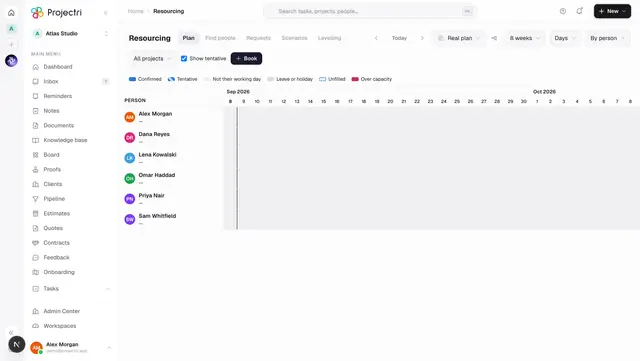
- Capacity reads task estimates. Resourcing reads bookings. They are two different commitments to the same person's week and neither includes the other.
- At most 2000 tasks are read for the window, and the grid runs at most 26 weeks forward.
Related
- Resourcing — the same people, measured by bookings rather than estimates.
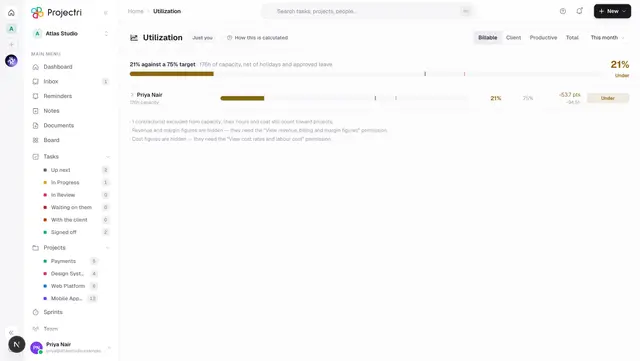
- Utilization — what those weeks turned into once they happened.
- My tasks — where the estimates and dates behind this grid are set.