Dashboards
Build a board of charts from a catalogue of metrics and datasets, or copy one of the six shipped templates, and choose who can see it.
What it is
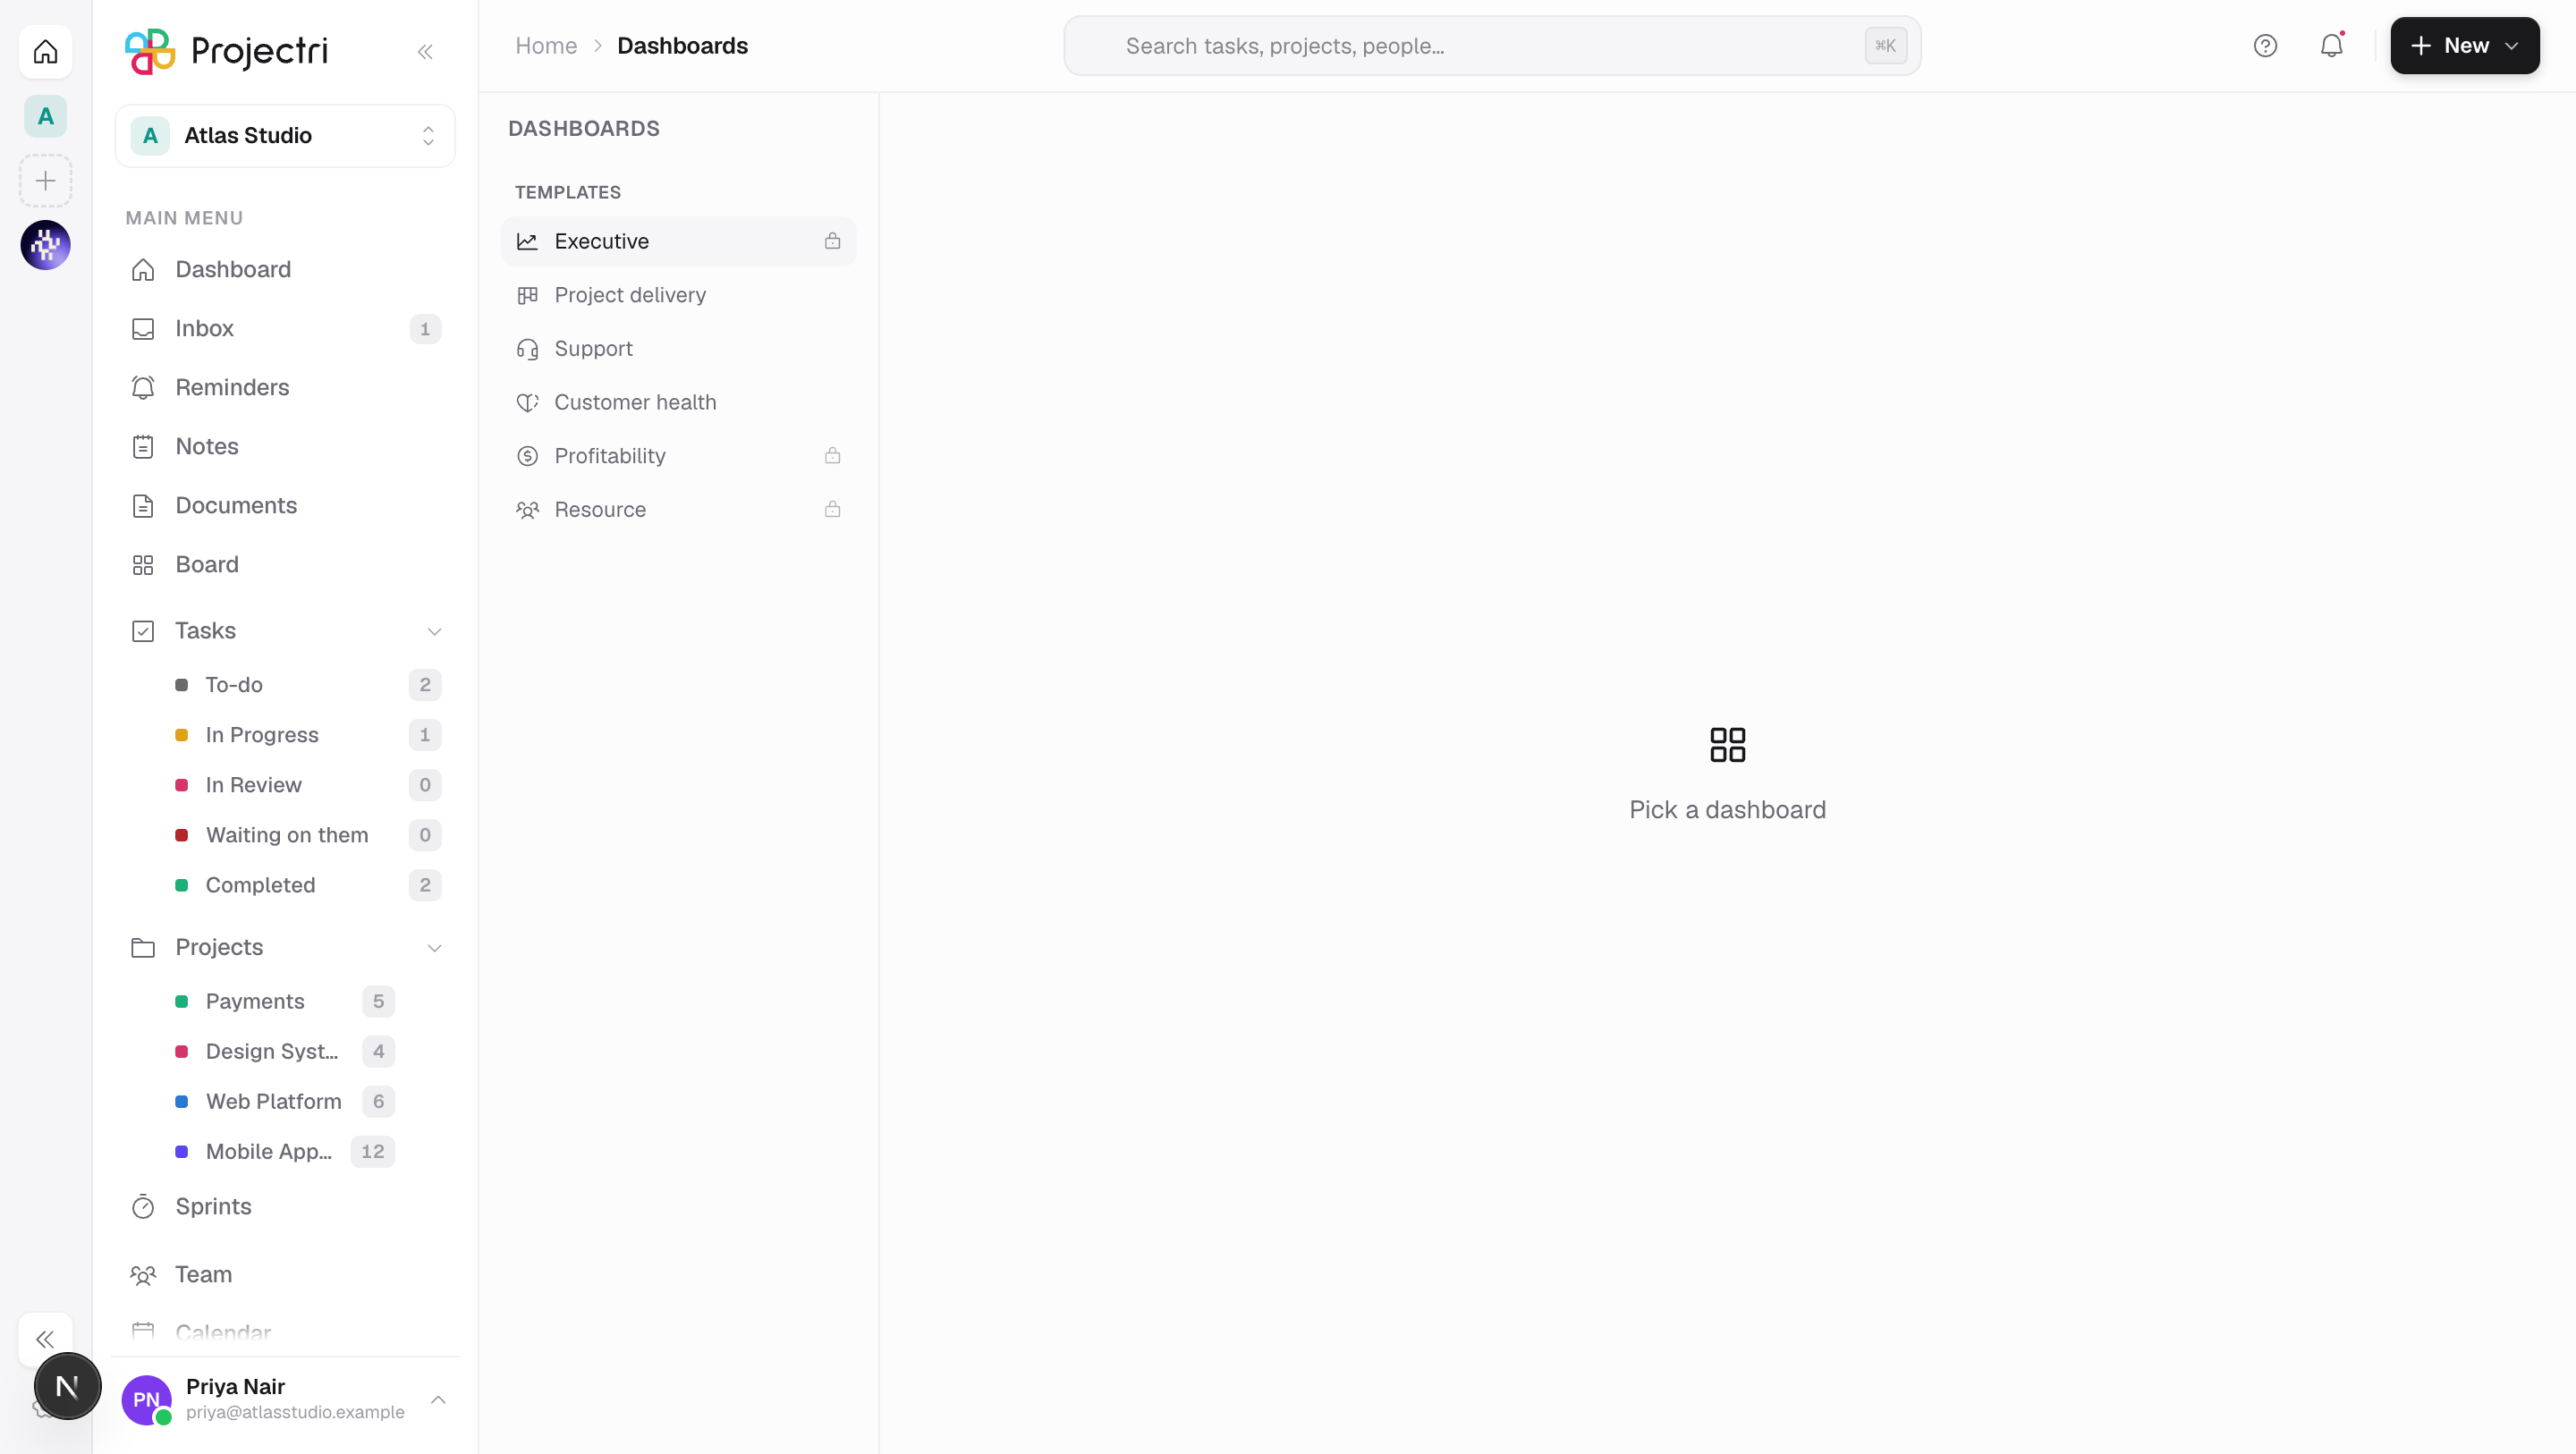
Dashboards answers a question you chose, where the fixed report pages answer ones we chose. A dashboard is a grid of widgets; each widget names a chart type, one or more metrics, a dimension to group by and a row cap. Six templates ship with every workspace and are copied rather than edited, so improving one next quarter does not rewrite a board somebody has been tuning.
How to get there
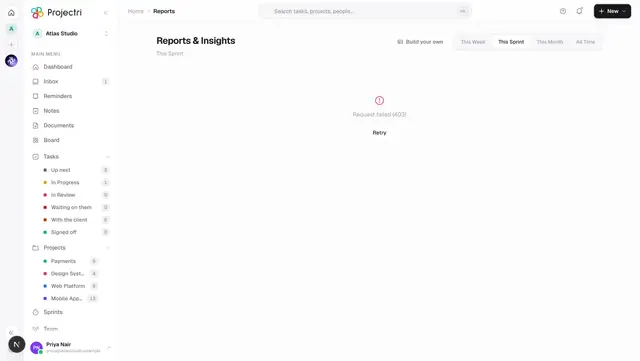
Dashboards is in the main navigation, beside Reports, and in the ⌘K page search. The New menu in the header has a Dashboard row.
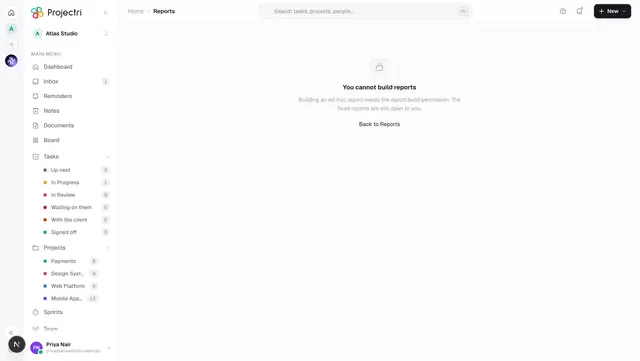
- The nav row is gated on
dashboard.build, not ondashboard.view— every member holds view because Home is their landing page, and gating the row on it would put the whole template gallery in front of people with no reason to assemble one. - The read routes stay on
dashboard.view, so a dashboard published to somebody still opens from its link. dashboard.shareis what lets you move a dashboard off Only me. Without it, a dashboard you create lands as personal rather than being refused.
There is no plan gate.
How to use it
Open one
- The rail on the left lists your dashboards first and Templates underneath.
- Pick one. The board loads and the widgets fill in.
- Range at the top right filters every widget that has a date to filter on: All time, or the last 7, 30, 90 or 365 days. The default is 30 days.
- The range is applied per dataset against that dataset's own date field —
startTimeon time entries,issueDateon invoices — and is dropped for widgets whose data has no such field, so a customer-count tile is not silently emptied by a date range that means nothing to it.
Start from a template
- Select a template in the rail — it carries a Template badge.
- Press the copy icon in the header.
- You get your own editable copy, owned by you, visible to Only me, with every widget in place. The original is untouched.
Templates are read-only to everyone, including admins. The copy button is the way in, and it is the only way in.
Create an empty one
- Press + at the top of the rail, or New dashboard.
- Name it. It is created as Only me and opens in edit mode.
- Press Add widget.
Build a widget
- In edit mode, press Add widget, or the gear on an existing one.
- Choose the kind: Stat (one number), Gauge (one number against 100%), Bar (compare across a dimension), Donut (share of a whole), Line (change over time), Table (several metrics per row) or List (ranked rows).
- Pick the metrics. Bar, donut, line, table and list also need a group by dimension.
- Set the row limit — between 1 and 100.
- Save. The widget is placed in the next free slot on a 12-column grid; drag the handle to move it and the corner to resize.
Rename, duplicate, delete
- Rename — the pencil, on a dashboard you can edit that is not a template.
- Duplicate — the copy icon, available to anyone who may build. A copy of a normal dashboard lands as Only me and owned by you.
- Delete — the bin, on a dashboard you can edit that is not a template. It asks first and cannot be undone.
Decide who can see it
- Turn on Edit.
- Visible to offers Only me, This workspace or Everyone.
- Moving off Only me needs
dashboard.share— publishing a board is a separate decision from building one.
What it affects
- What the numbers can be. Widgets read from a fixed registry of datasets: tasks, time entries, time entries with money on them, tickets, work orders, invoices, expenses, projects and customer contacts. There is no free SQL — a dashboard that named its own table could not carry the tenant guarantee, and the first one saved would be reading another workspace's rows.
- Permissions are checked twice. The dashboard's visibility governs the container; the numbers inside are gated per dataset. A dashboard visible to everyone can still contain a margin widget most of them cannot read. When that happens the widget says "N metrics hidden by permissions" rather than quietly showing zero.
- The gated datasets are money on time entries (
report.financial, with the cost column additionally behindreport.cost), invoices (finance.invoice.view), expenses (finance.expense.view) and customer contacts (portal.view). - Three of the six templates carry their own gate. Executive and Profitability require
report.financial; Resource requiresreport.utilization. A copy carries the gate across, and you cannot duplicate a template whose gate you do not hold. - A shared metric catalogue. "Billable hours" means the same thing on every board, because the metrics are seeded once per workspace rather than per template. Two definitions of the same words is how two directors quote different numbers in the same meeting.
- Nothing you build here changes data. Dashboards read.
On mobile
The Dashboards screen in the Expo app reads the same boards and offers the same date ranges as a chip strip, but has no builder. Composing a widget means picking a chart, a set of metrics, a dimension and a row cap and placing it on a 12-column grid, which is a desk job — a phone-sized version produces layouts someone repairs on a laptop afterwards.
Limits and gotchas
- **The six templates are Executive, Project delivery, Support, Customer health, Profitability and Resource.** They are created on your first visit to this page rather than at sign-up.
- A widget over a very long span is capped and says *"Showing the first 20,000 rows"* under its title when it hits the limit.
- A broken widget fails alone. A widget whose metric no longer resolves shows its own error rather than emptying the page.
- A widget's geometry is clamped on write, so a bad drag cannot store a widget 400 columns wide.
- Deleting a dataset from the registry would orphan the metrics built on it, so dataset keys are permanent once shipped.
- Two saved filters on the same field are combined rather than one overwriting the other — a date range cannot quietly become a half-range.
Related
- Reports — the fixed readings, which these are the configurable equivalent of.
- Report builder — row-level reports rather than charts.
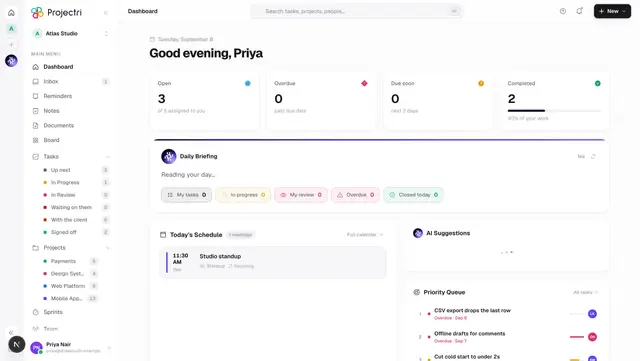
- Home — the landing dashboard every member sees.
- Permissions — how the per-dataset gates are decided.