Using a board
The whiteboard canvas — sticky notes, shapes, connectors, drawings, tables with formulas, charts, images and embedded records, edited live by everybody at once.
What it is
A board is an infinite canvas. You put sticky notes, text, shapes, freehand drawings, connectors, sections, tables, charts, pictures and links to real Projectri records on it, and everyone else on the board watches it happen — their cursors, their selections and the shape they are dragging, live.
How to get there
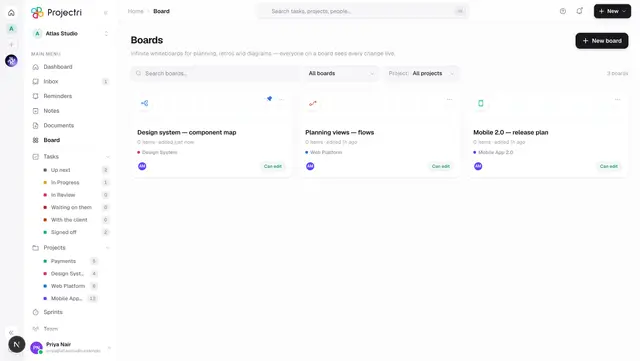
Open a board from Boards, from a project's boards tab, or from a link. Reading needs board.view and access to that board; editing needs board.update and edit access on the row. Share appears only for the board's owner, and needs board.share.
If you cannot edit, the canvas says View only at the top, only Select and Pan are available, and every other tool is greyed with the same words as its tooltip.
How to use it
The toolbar
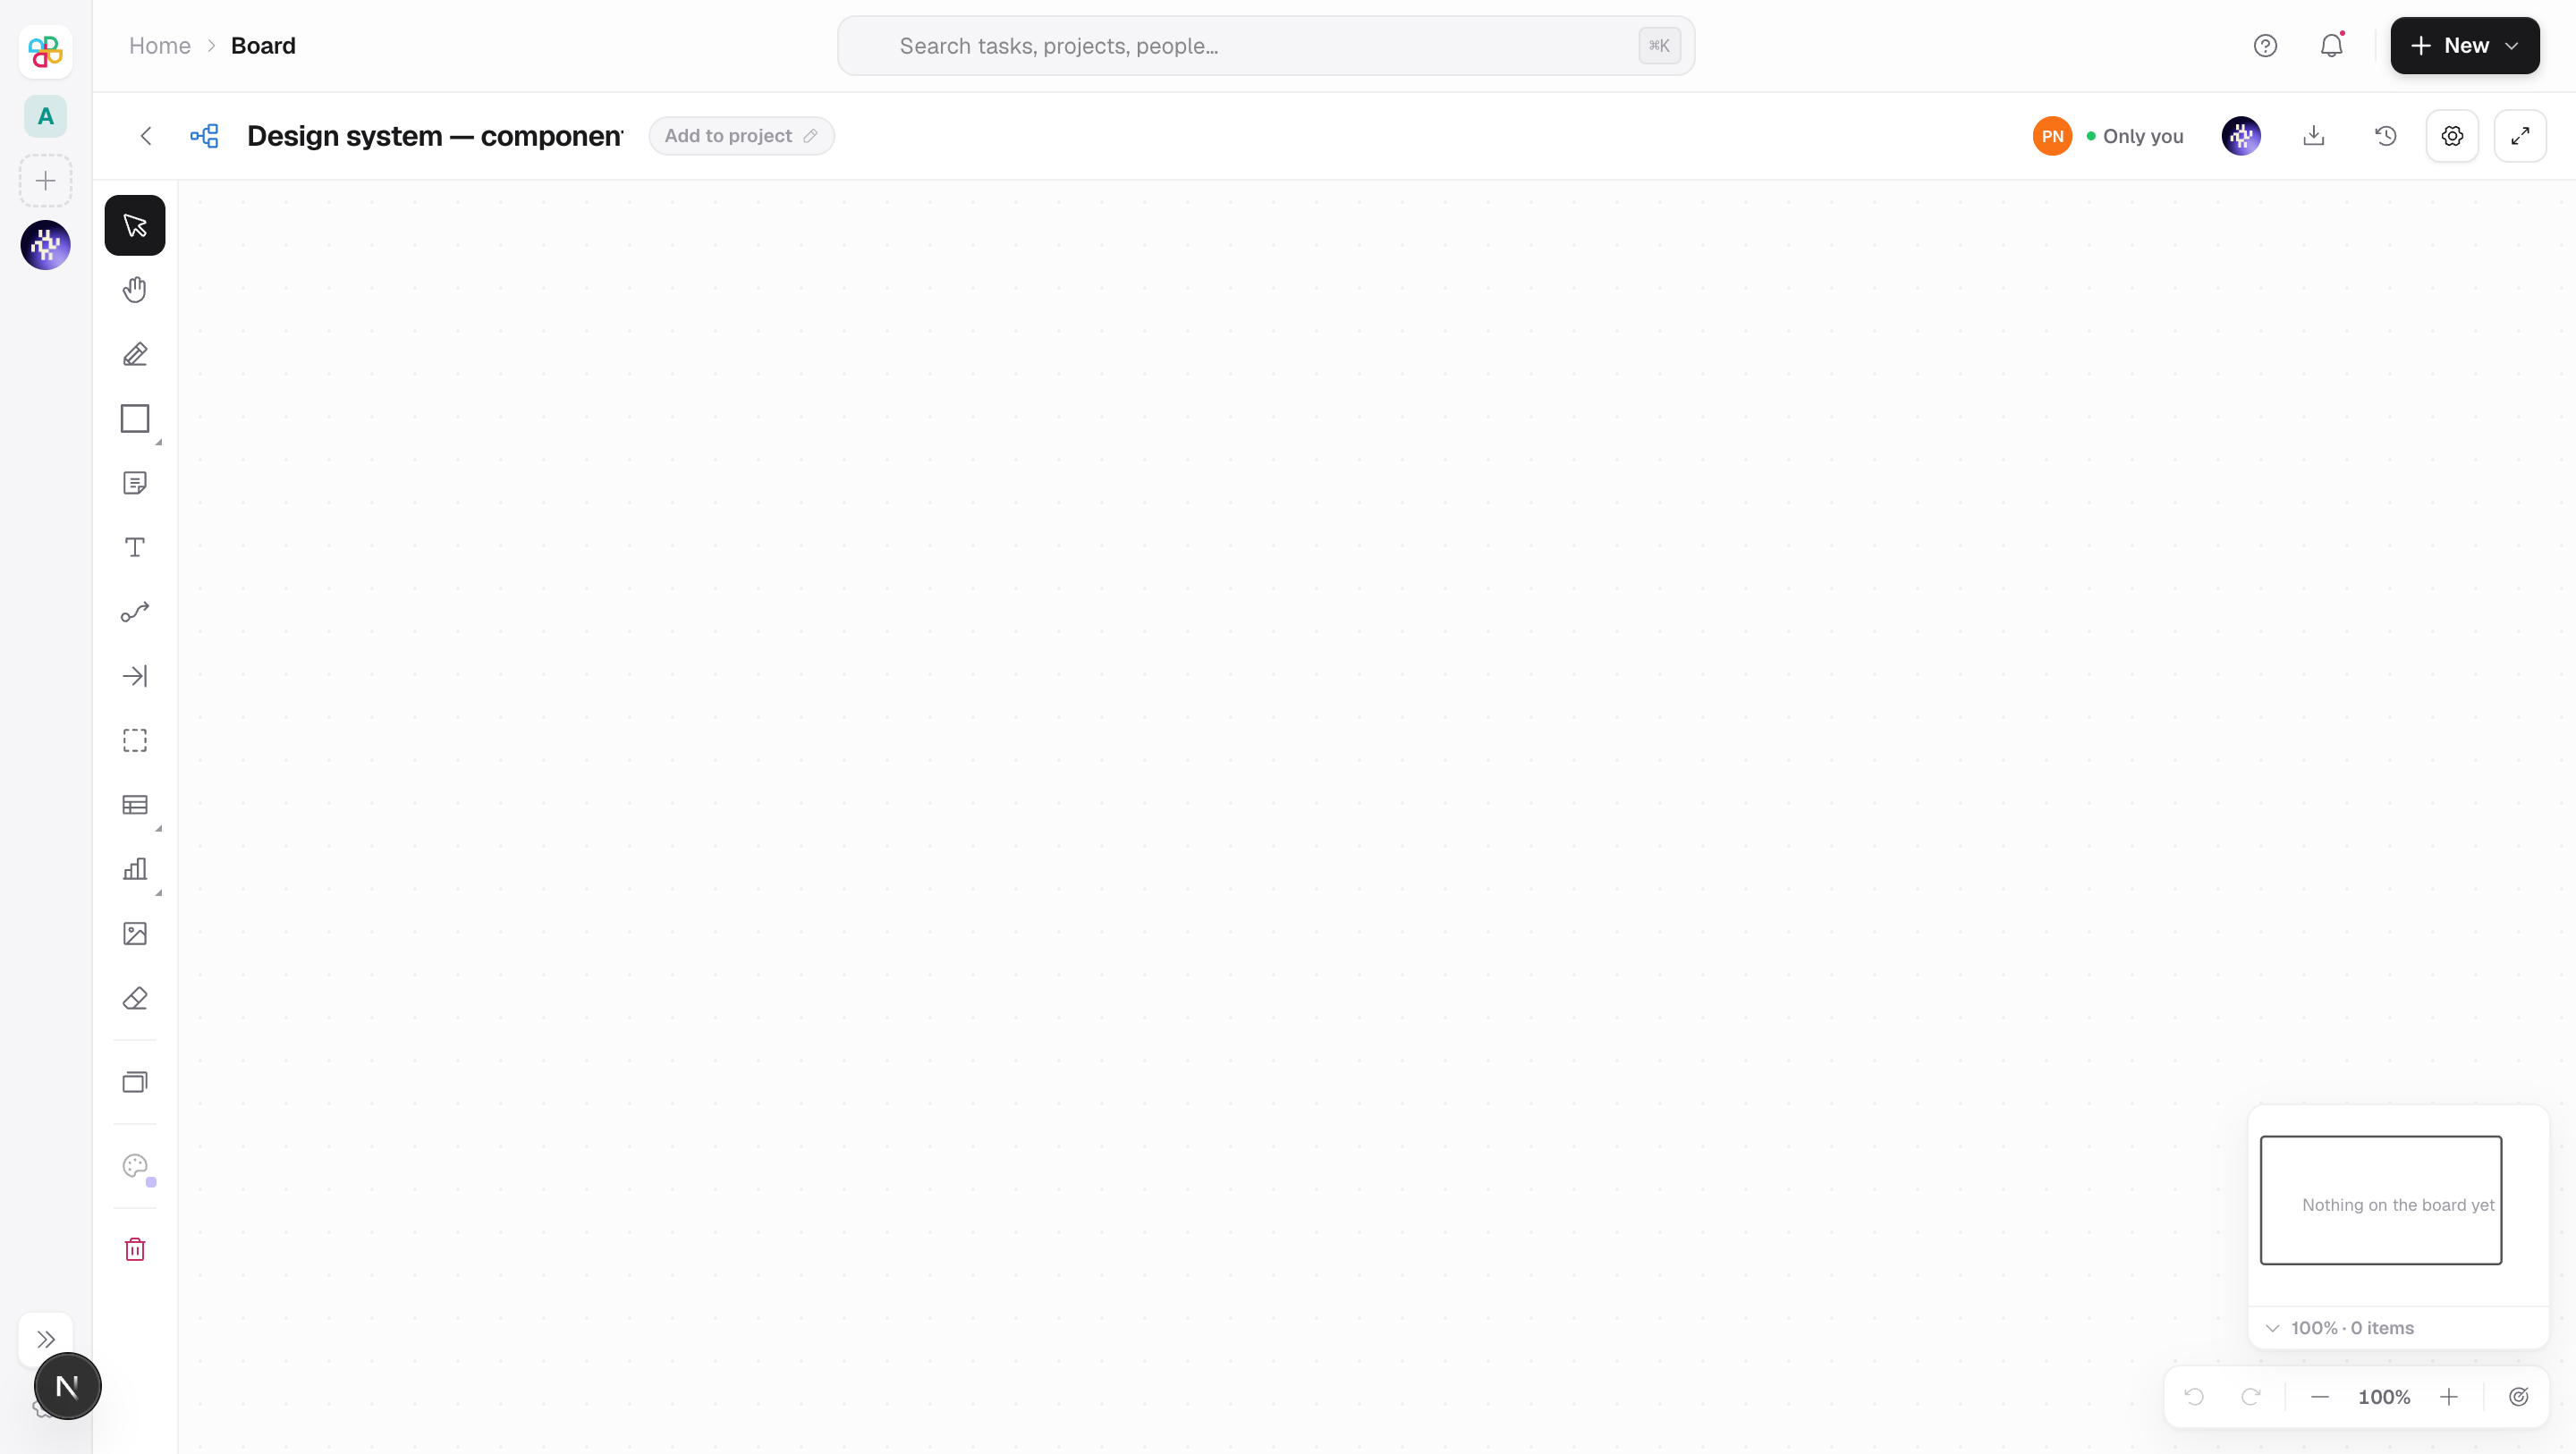
The rail down the left holds thirteen tools, each with a single-key shortcut:
| Tool | Key |
|---|---|
| Select | V |
| Pan | H (or hold Space) |
| Draw | P |
| Shape | R |
| Sticky note | S |
| Text | T |
| Connector | X |
| Arrow | A |
| Section | F |
| Table | B |
| Chart | G |
| Image | I |
| Eraser | E |
Shapes, tables and charts have a second click: press the tool again to choose which shape, which grid or which chart type. Sticky notes, text, tables and charts are placed with a click; shapes, sections, arrows, connectors and drawings are dragged out.
Below the tools are three more buttons: Insert a template, Style options and Clear the board.
Shapes
Twenty-five shapes in three groups. Basic has Rectangle, Rounded, Ellipse, Triangle, Merge, Decision, Pentagon, Hexagon, Octagon, Star, Data, Trapezoid, Database, Cloud, Cross and Callout. Flowchart has Start / end, Document, Subprocess, Manual input, Delay and Display. Arrows has Chevron and the four directional arrows. Every shape takes a text label — a shape you have just drawn opens for typing. The shape you picked last is remembered for next time.
Connectors
- Arm the connector tool with X and drag from one thing to another.
- An end that started or landed on an item is bound to it; an end on empty canvas stays pinned to that point, so a connector also works as a plain labelled line.
- A bound connector recomputes itself whenever either item moves, anchoring to whichever edge faces the other.
- Select a connector to get a grip at each end. Drag a grip to re-attach it, double-click it to detach. A filled grip is bound; a hollow one is loose.
- Double-click the line to label it, or use the style panel.
- Choose Elbow, Straight or Curved routing, and Plain line, One end or Both ends for arrowheads.
Deleting the item at one end does not delete the connector — it goes dashed and faded so you can see what was lost.
Sections
The Section tool (F) draws a labelled frame. A section selects from its caption strip and its border, not from its middle — the middle belongs to whatever is inside it. Sections paint as their own band underneath everything else, so reordering a section only moves it against other sections.
Tables and formulas
- Place a table with B. The default is 3 columns by 4 rows with a header row; you can pick the grid before placing it.
- Click once to select the table, click again to work in its cells. Escape leaves cell mode before it does anything else.
- Arrows walk the grid, shift-arrows extend, Enter or F2 opens a cell, and typing overwrites it. Tab continues at the start of the next row.
- The format bar above the selection sets cell fill, text colour, borders, typeface, size, bold, italic, underline and alignment, and shows Sum, Avg and Count for a numeric block.
- Σ writes a real formula —
=SUM(B2:B7)— and will grow the table by a row or column if the total belongs just outside the grid. - Any cell starting with
=is a formula. References are A1-style, ranges areA1:B2, and they are rewritten for you when rows or columns are inserted, deleted, duplicated or moved.
The formula language covers the usual aggregates (SUM, AVERAGE, MEDIAN, MIN, MAX, COUNT, COUNTA), maths and rounding, statistics (STDEV, VAR), conditional aggregates (SUMIF, SUMIFS, COUNTIF, AVERAGEIFS, MAXIFS, MINIFS), logic (IF, IFS, IFERROR, AND, OR, SWITCH, CHOOSE), text functions (CONCAT, TEXTJOIN, LEFT, MID, SUBSTITUTE, TEXT and the rest), lookups (INDEX, MATCH, VLOOKUP, HLOOKUP) and dates (TODAY, DATE, YEAR, WEEKDAY, EDATE). Errors read as #DIV/0!, #VALUE!, #REF!, #NAME?, #NUM!, #N/A and #CIRC!.
Row and column grips add, duplicate, move and delete tracks; the right-click menu does the same. Header row, Header column and Striped are display switches.
Charts
Eleven kinds: Column, Bar, Line, Area, Pie, Donut, Scatter, Funnel, Gauge, Radar and Stat. Place one with G, then type its numbers into the style panel — a title, categories, one or more series, and toggles for Stacked, Values, Grid and Legend, plus a unit.
Pictures
Add one with I, by dropping a file on the canvas, or by pasting a screenshot with ⌘V. Pictures must be PNG, JPEG, WebP or GIF and under 10 MB; a larger or wrong-typed file is refused by name. A big picture is scaled down to fit but a small one is never blown up. Corner handles keep the aspect ratio; side handles crop. The right-click menu offers Replace picture…, Reset to original size and Open full size — the last of which viewers get too.
Embedding a record
Right-click empty canvas and choose Embed task, ticket, doc…. The picker has tabs for Tasks, Tickets, Docs and Dashboards and searches the workspace. The card on the board shows the record's live title, subtitle and status, and links through to it.
A record you are not allowed to read shows as Not available — identical to a record that was deleted, on purpose.
Templates
Insert a template offers 27 layouts across Basics, Strategy, Product, Engineering, Design, Marketing, People, Data and Meetings — among them Brainstorm, Affinity map, Empathy map, Mind map, Flowchart, System architecture, Root cause (fishbone), Sprint retrospective, Incident postmortem, Kanban board, Product roadmap, Impact / effort matrix, User story map, Customer journey, SWOT analysis, Lean canvas, OKR planning, RACI matrix, Org chart, Onboarding plan, Growth funnel, Campaign plan, KPI dashboard, Sales review, Daily standup and Meeting notes. A template lands in the middle of your current view as one undoable step, and moves nothing already on the board.
Selecting, ordering, locking
- Click to select, shift-click to add or remove, drag on empty canvas for a rubber band, ⌘A for everything. Escape unwinds one layer at a time.
- Layering: Bring to front (
]), Bring forward (⇧]), **Send backward** (⇧[), Send to back ([). - Lock freezes an item in place. Locked items can still be selected, copied, styled and unlocked, but not moved, resized, typed into, erased or deleted.
- ⌘C and ⌘V copy and paste; ⌘D duplicates 24 pixels down and right.
- Delete or Backspace removes the selection, skipping anything locked. The Eraser rubs out continuously, and so does the far end of a stylus.
- Clear the board asks first: *"Every item on it is deleted. You can undo this with ⌘Z."*
- ⌘Z and ⌘⇧Z (or Ctrl+Y) undo and redo, and the menu names what they will undo. Undo and redo are your own — they do not undo a colleague's work.
Moving around
- Pan with the H tool, by holding Space, by middle-dragging, or with one finger on a touchscreen.
- Zoom with the wheel or a pinch, between 15% and 400%. The cluster in the corner has Zoom out, the current percentage, Zoom in and Fit to content.
- Reset zoom returns to 100%.
- The minimap in the corner can be collapsed to a Map button; click or drag inside it to move the view.
- ⇧F goes fullscreen.
Ask Nia about a selection
Select something and an Ask Nia pill appears next to it. Ask in your own words — "tidy the layout", "explain this" — and the selection is sent with the question so she knows what "this" is. What she makes arrives over the live channel as ordinary items you can drag, retype or undo; nothing is marked as machine-made. The board also animates to frame whatever she is drawing, and stops the moment you touch the canvas yourself.
Version history
The clock button opens Board history. A version is cut automatically before each edit, at most one every five minutes, and captures the whole board. Save a version now cuts one by hand, and Name one to keep it for ever. Restore saves the current board first, so a restore can itself be undone, and every open tab reloads the board when it lands.
Share and export
Share offers Everyone (anyone in the workspace can edit) or Invite only, a per-person list with Can edit or Can view, and a public link. The public link can be set to View only or View and edit — a signed-out visitor holding an editable link can draw on the board and appears in the roster as a guest. Turning the link off revokes it; turning it back on mints a new one.
Export produces a PDF, in landscape or portrait. It is the only format offered, because a text format would keep the labels and lose the drawing. Viewers can export.
What it affects
- Everyone sees everything, immediately. Changes stream over a live connection: items, presence, and the shape somebody is mid-drag. A shape being dragged is broadcast but not saved until it is dropped.
- The camera belongs to the board, not to you. Where you leave the view is where the next person to open the board arrives. A read-only visitor never moves it.
- A public editable link is a real grant. Anybody holding it can change the board without an account.
- Sharing notifies the person you shared with.
- Duplicating a board leaves the shares and the public link behind.
- Filing under projects puts the board on those projects' boards tabs. The first project is the primary.
- Pictures count against workspace storage.
On mobile
The phone opens a board in a read-only viewer with pinch-to-zoom and pan. It is not an approximation — the shapes, connector routing, table layout and chart maths are the same ones the web uses. Editing stays on the web, and the screen says so rather than offering controls that do nothing.
Limits and gotchas
- There is no snapping and no alignment guides. Nothing snaps to a grid, and there are no align or distribute commands. The dot grid is decoration.
- There is no grouping. A multi-selection moves together and can be duplicated or deleted together, but it is not saved as a group — it is gone the moment you click elsewhere.
- A sticky two people type into at once is last-write-wins: whoever finishes last keeps their text. Everything else merges cleanly.
- Undo is local. Your undo stack holds your own last 120 actions and does not reach across to anybody else's work.
- Copy and paste is board-local. ⌘C puts an item on Projectri's own clipboard, which survives moving to another board but does not talk to other applications. Pasting an image from your system clipboard still works.
- A table is capped at 60 rows and 24 columns, with 500 characters per cell. A chart holds at most 12 series and 60 points, and its palette has 8 colours before it starts using grey.
- Item text is capped at 4,000 characters; a connector or section label at 200.
- A freehand stroke holds at most 4,000 points.
- Connectors cannot be copied, duplicated or dragged — move what they are attached to instead.
- If you cannot click a section, click its title strip or its border. Its middle belongs to whatever is inside it.